https://www.youtube.com/watch?v=4-j_0CtZ1xw
[범례 자료] Matplotlib Legend API
[마커 자료] Matplotlib Markers API
[스타일 자료 1] Matplotlib Plot Styles
[스타일 자료 2] Matplotlib Line Styles
9.그래프.py [Download]
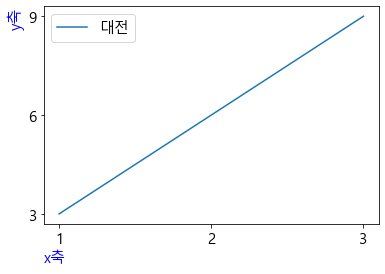
[데이터] 대전 날씨.xlsx [Data Source]
import matplotlib.pyplot as plt

x = [1, 2, 3, 4, 5]
y = [10, 15, 7, 12, 20]

plt.plot(x, y, marker='o', linestyle='-', color='b', label='기본 그래프')
plt.xlabel('X축')
plt.ylabel('Y축')
plt.title('기본 그래프')
plt.legend()
plt.show()
plt.plot(x, y, marker='o', linestyle='-', color='r', label='데이터 1')
plt.plot(x, [5, 10, 15, 10, 5], marker='s', linestyle='--', color='g', label='데이터 2')
plt.xlabel('X축')
plt.ylabel('Y축')
plt.title('범례가 포함된 그래프')
plt.legend()
plt.show()
plt.plot(x, y, marker='^', linestyle=':', color='purple', label='점선 스타일')
plt.xlabel('X축')
plt.ylabel('Y축')
plt.title('스타일 적용된 그래프')
plt.legend()
plt.show()
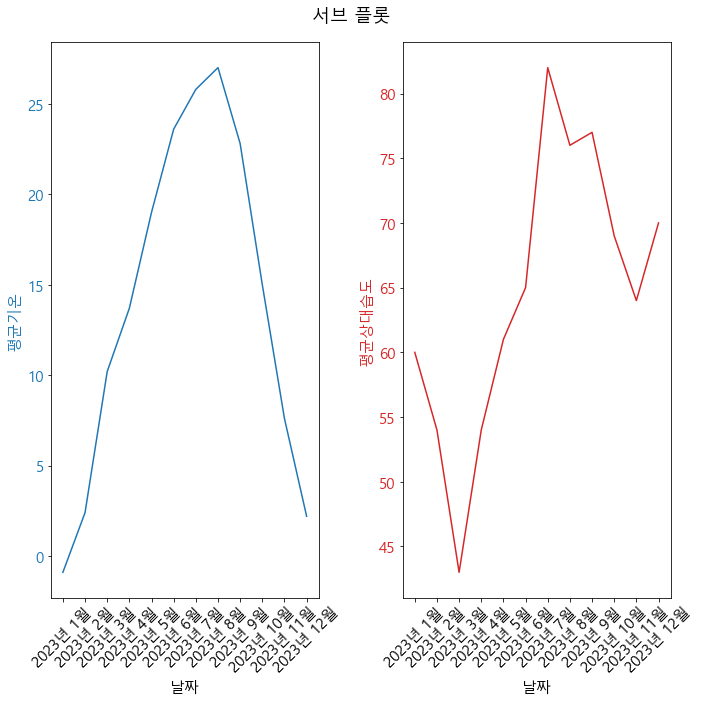
fig, axes = plt.subplots(2, 1, figsize=(6, 8))

axes[0].plot(x, y, marker='o', color='b', label='그래프 1')
axes[0].set_title('서브 플롯 1')
axes[0].legend()

axes[1].plot(x, [20, 12, 7, 15, 10], marker='s', color='r', label='그래프 2')
axes[1].set_title('서브 플롯 2')
axes[1].legend()

plt.tight_layout()
plt.show()